Page last modified: Jul 27 2021.
Visualize Seabed Gradient with DVL
This example demonstrates a simple method for moving a DVL sensor through a scene in Gazebo and generating a gradient map of the seabed. Two examples are available, one using the UUV Simulator DVL, and the other using the Woods Hole Oceanographic Institute’s Deep Submergence Lab (DSL) environment DVL.
Launching Example
The following launch files start the example depending on the DVL. For the DSL DVL:
roslaunch dave_demo_launch dave_dvl_gradient_demo_uuvsim.launch
and for the UUV Simulator DVL:
roslaunch dave_demo_launch dave_dvl_gradient_demo_dsl.launch
Running either launch script starts gazebo and loads a standalone DVL model. The ocean world contains a seabed with known slope values. The script also starts three nodes:
/twist_keyboard

/twist_dvl_state

/plot_gradient
Generating the Gradient Map
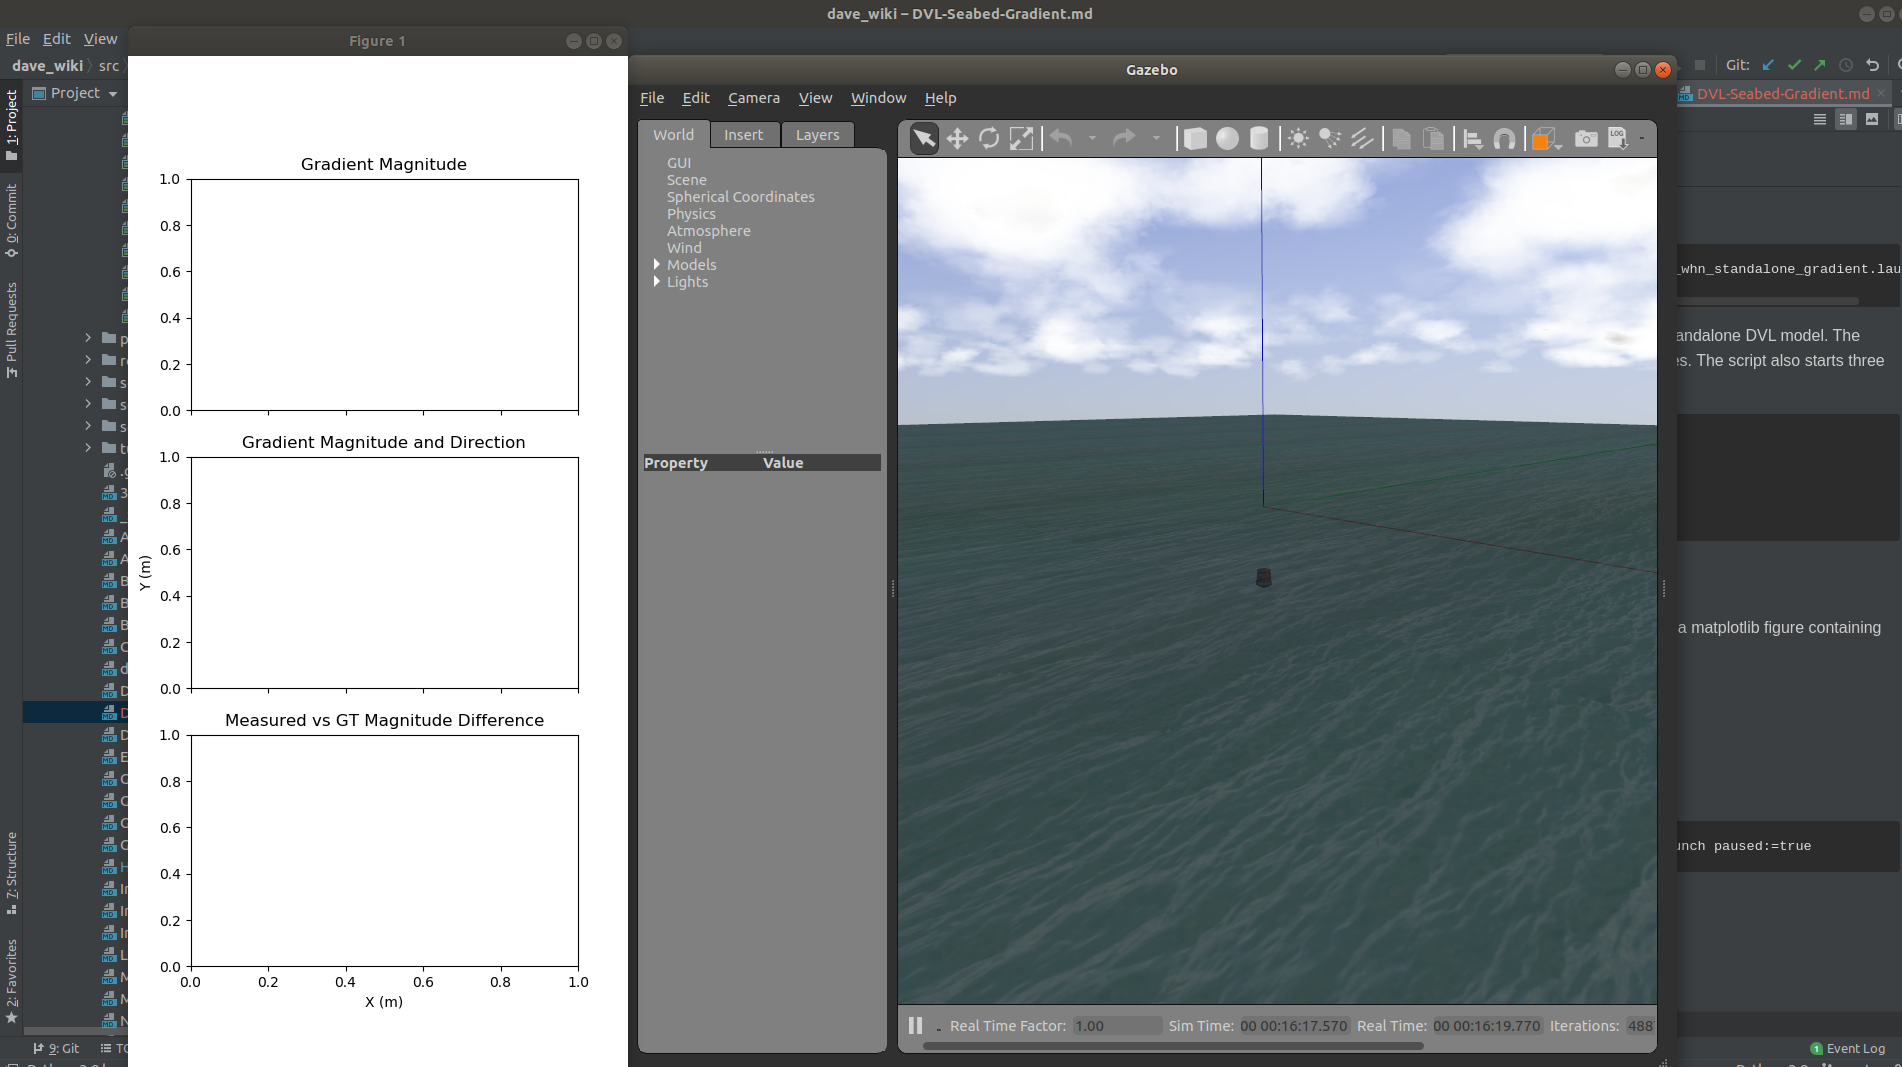
The launch script should spawn a gazebo window and a figure containing three empty subplots.
In order to build the gradient maps, the sensor must be moved through the scene. The terminal in which the nodes are launched is running the /twist_keyboard node. The control keys are:
Moving around:
    u   i   o
    j   k   l
    m   ,   .

Strafing:
    U   I   O
    J   K   L
    M   <   >

q/z : increase/decrease max speeds by 10%
w/x : increase/decrease only linear speed by 10%
e/c : increase/decrease only angular speed by 10%
After moving the sensor around the map for some time, the plots should begin to look like:
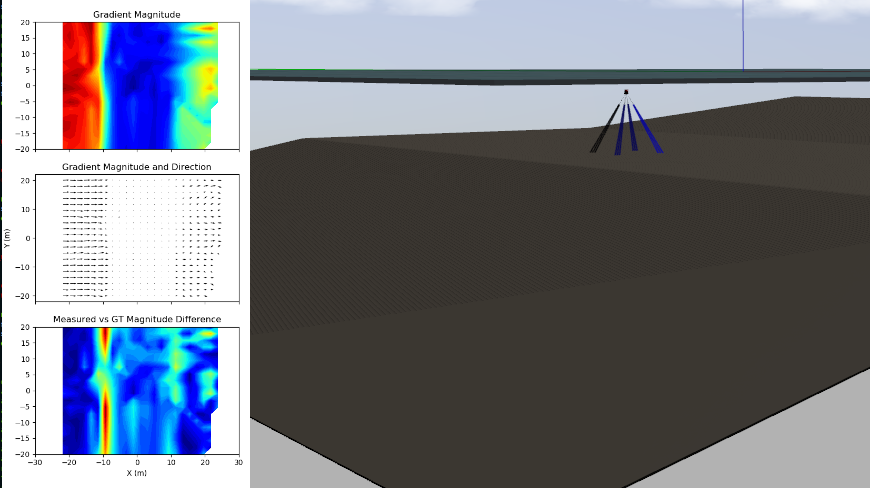
The top plot displays the measured gradient magnitude where warmer colors represent a larger gradient. The central plot shows the magnitude and direction as a quiver plot. The bottom plot shows the difference between the measured and ground truth (GT) gradient magnitude, where warmer colors represent a greater difference between the measured and GT values.
Implementation Details
On launch, the teleop_twist_keyboard node is started and publishes the /cmd_vel twist topic which is used here to send twist messages to the model.
dvl_state_and_gradient_(uuvsim/dsl).pyThis script instantiates a node that subscribes to the following topics with the UUV Simulator DVL:
  /whn/dvl_sonar0
  /whn/dvl_sonar1
  /whn/dvl_sonar2
  /whn/dvl_sonar3
  /gazebo/model_states
  /cmd_vel
and to the following with the DSL DVL:
  /whn/dvl
  /gazebo/model_states
  /cmd_vel
and publishes:
/dvl_gradientDSL
The
/whn/dvltopic contains a custom DVL message,ds_sensor_msgs/Dvl, from which we can extract range values from the individual beams within therangelist.UUV Simulator
The
/whn/dvl_*topics contain asensor_msgs/Rangemessage which reports a single range value per beam. The estimated range combined with the sensor layout described inteledyne_whn_uuvsim_description/urdf/teledyn_whn.xacroallows for gradient estimation.The
/gazebo/model_statestopic is published by gazebo and is required for keeping track of the model location within the world./gazebo/model_states/and/cmd_velfromteleop_twist_keyboardare used to set the twist of the model with theSetModelStateservice.dvl_gradientcontains ageometry_msgs/Pointmessage which packages the gradient asxandyfor the 2D direction of increasing gradient in world coordinates andzfor the magnitude.dvl_gradient_plot.pyThis script instantiates a node which creates the three realtime plots of the gradient measurements. The node subscribes to:
  /gazebo/model_states
  /dvl_gradient
The
scipy.interpolate.griddatafunction is used to bin and interpolate the data gathered while traversing the world.